7 min read
Out of Runway: The FY27 BCSD Budget
The Bibb County School District is staring at back-to-back eight-figure deficits, a fund balance falling toward zero, and a June 2 deadline. Here's what the math actually says.
I sat through last Thursday’s Bibb County Board of Education budget work session, and I left less encouraged than I went in.
The Superintendent’s team walked the board through a menu of cuts they describe as technically possible but explicitly not recommended. The kind of slide nobody puts up unless the math has stopped pretending. Dr. Sims wasn’t pitching these as a plan. He was showing the board what the floor looks like.
If you’d rather watch it for yourself, here’s the full work session. Everything below is my read on what happened in this room.
The hole we’re staring at
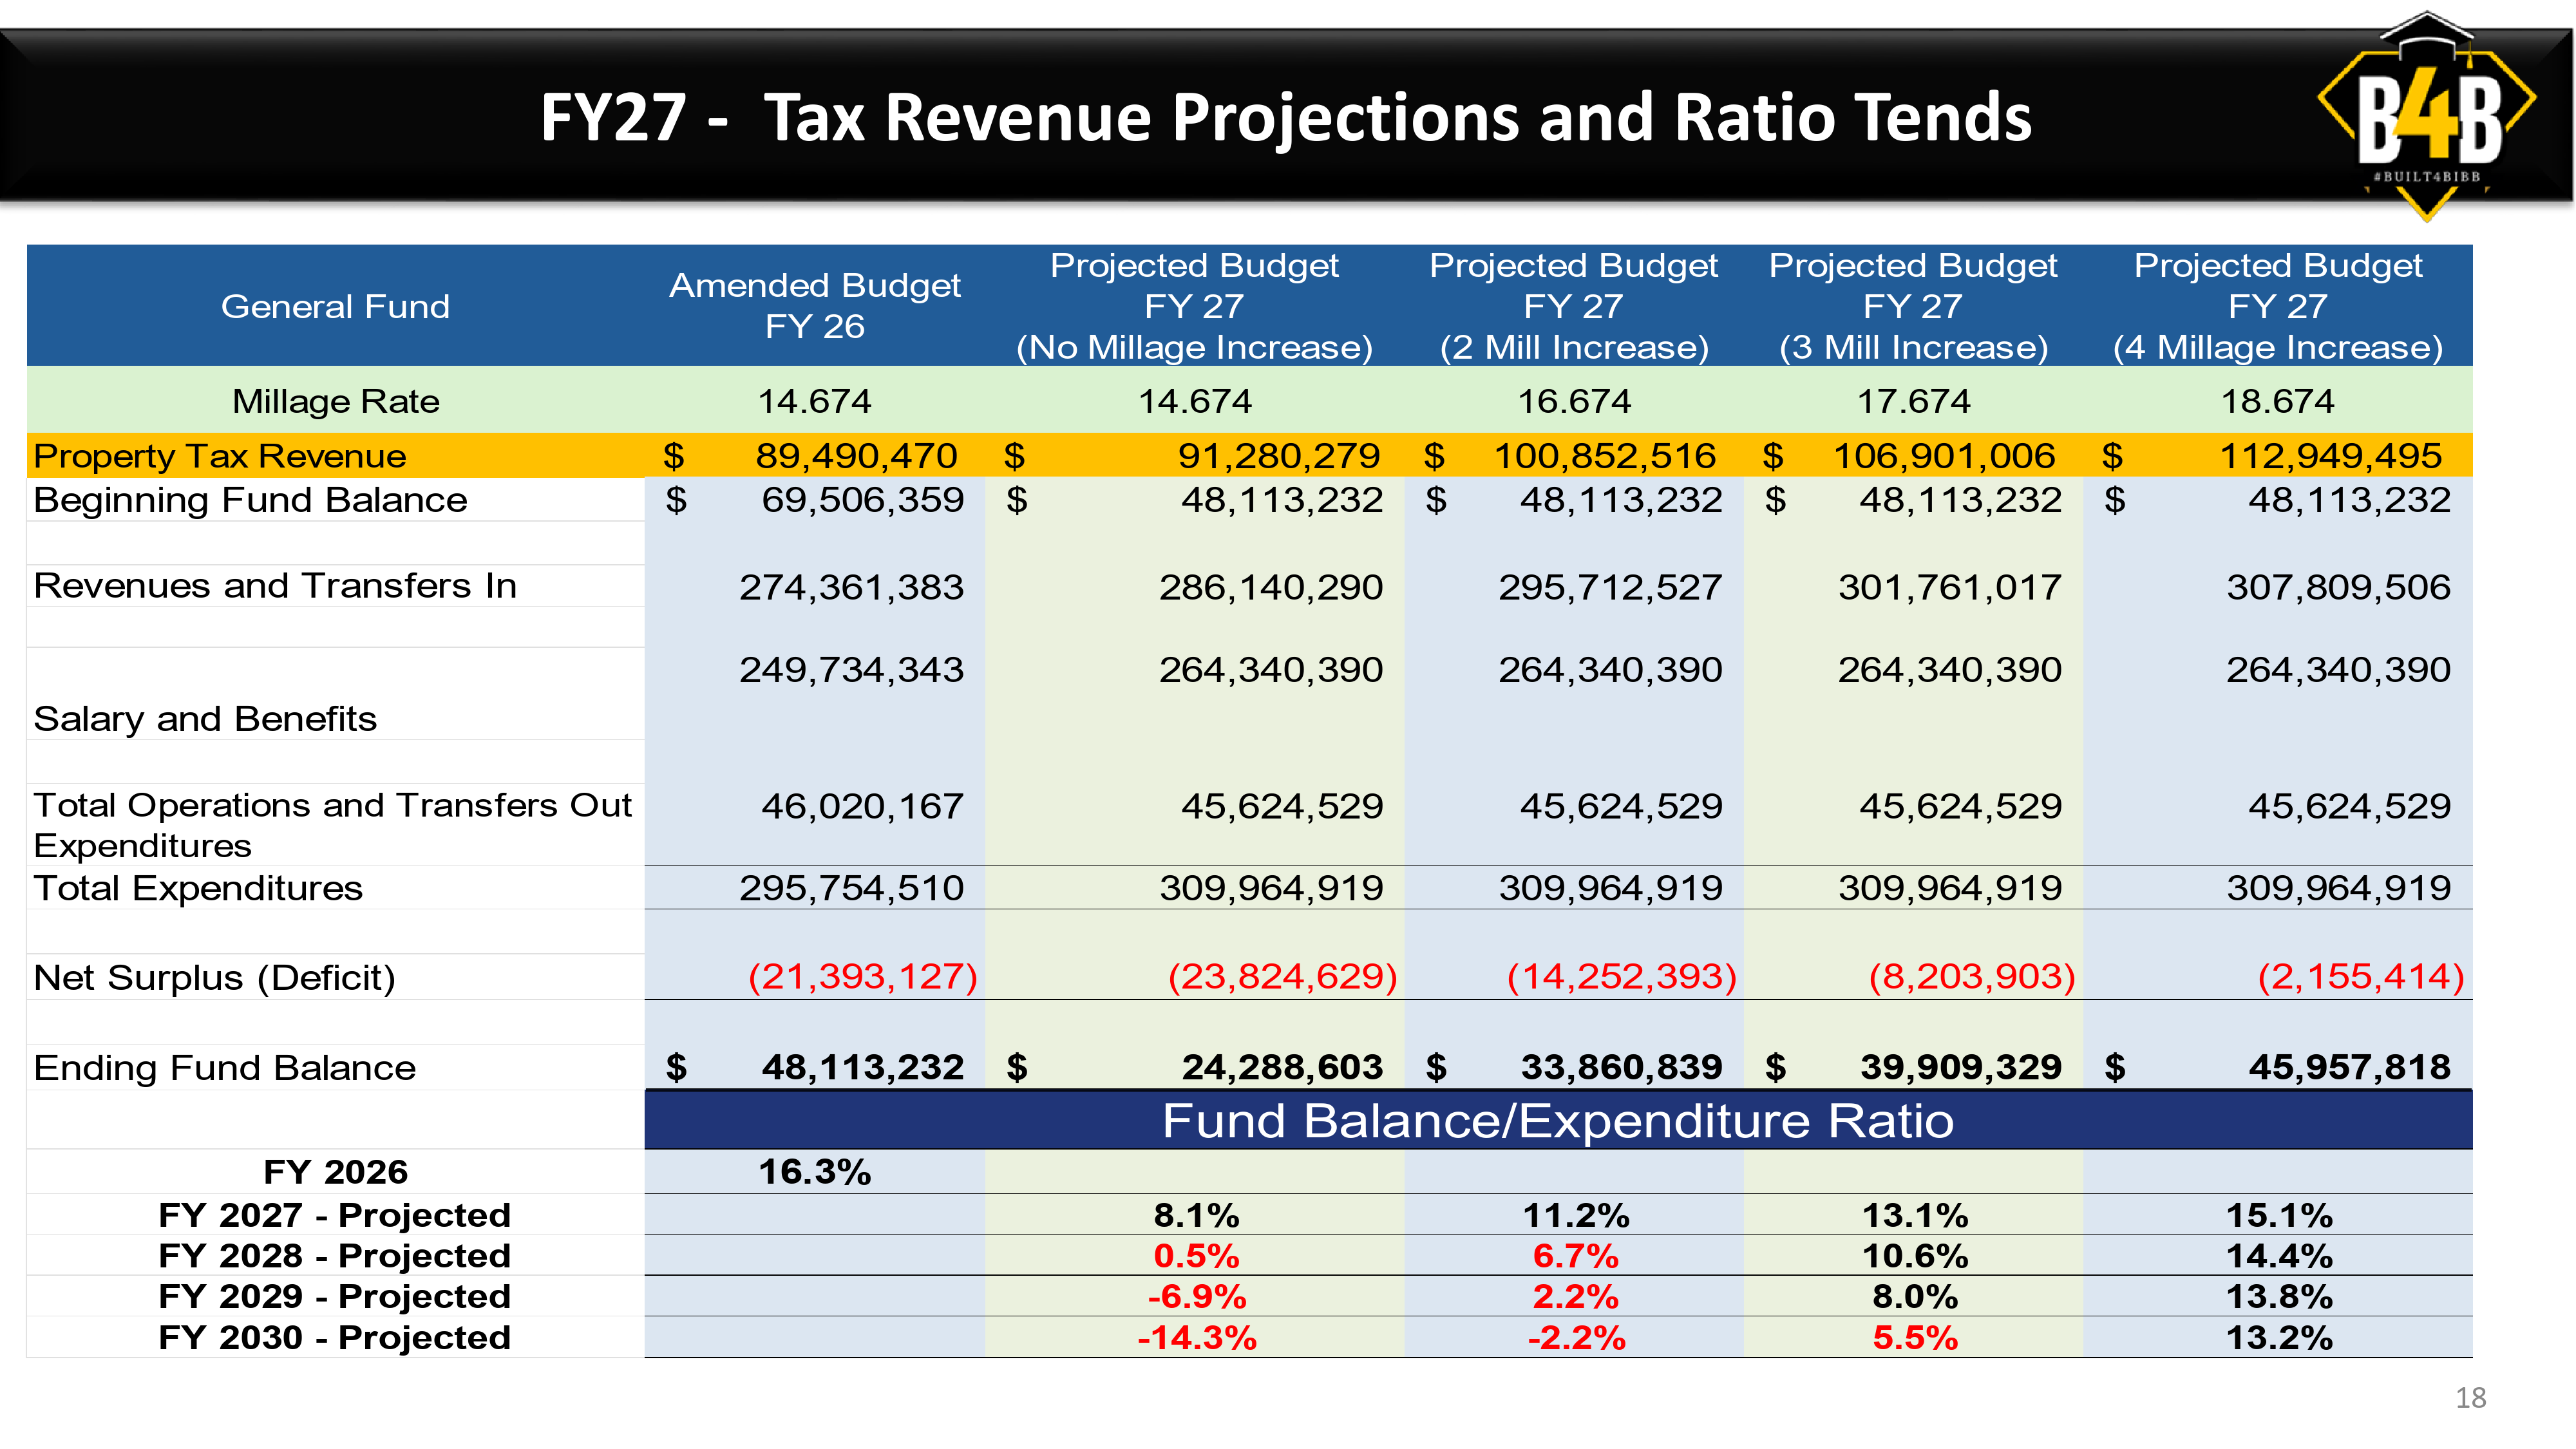
The tentatively-adopted FY27 General Fund budget, presented by CFO Eric Bush on May 14, lays out a $23.8 million deficit with no millage rate change. That’s on top of the $21.4 million deficit the district is already running in the current FY26 budget. Two back-to-back eight-figure deficits on a $310M General Fund.
A few headline numbers from the tentative adoption presentation:
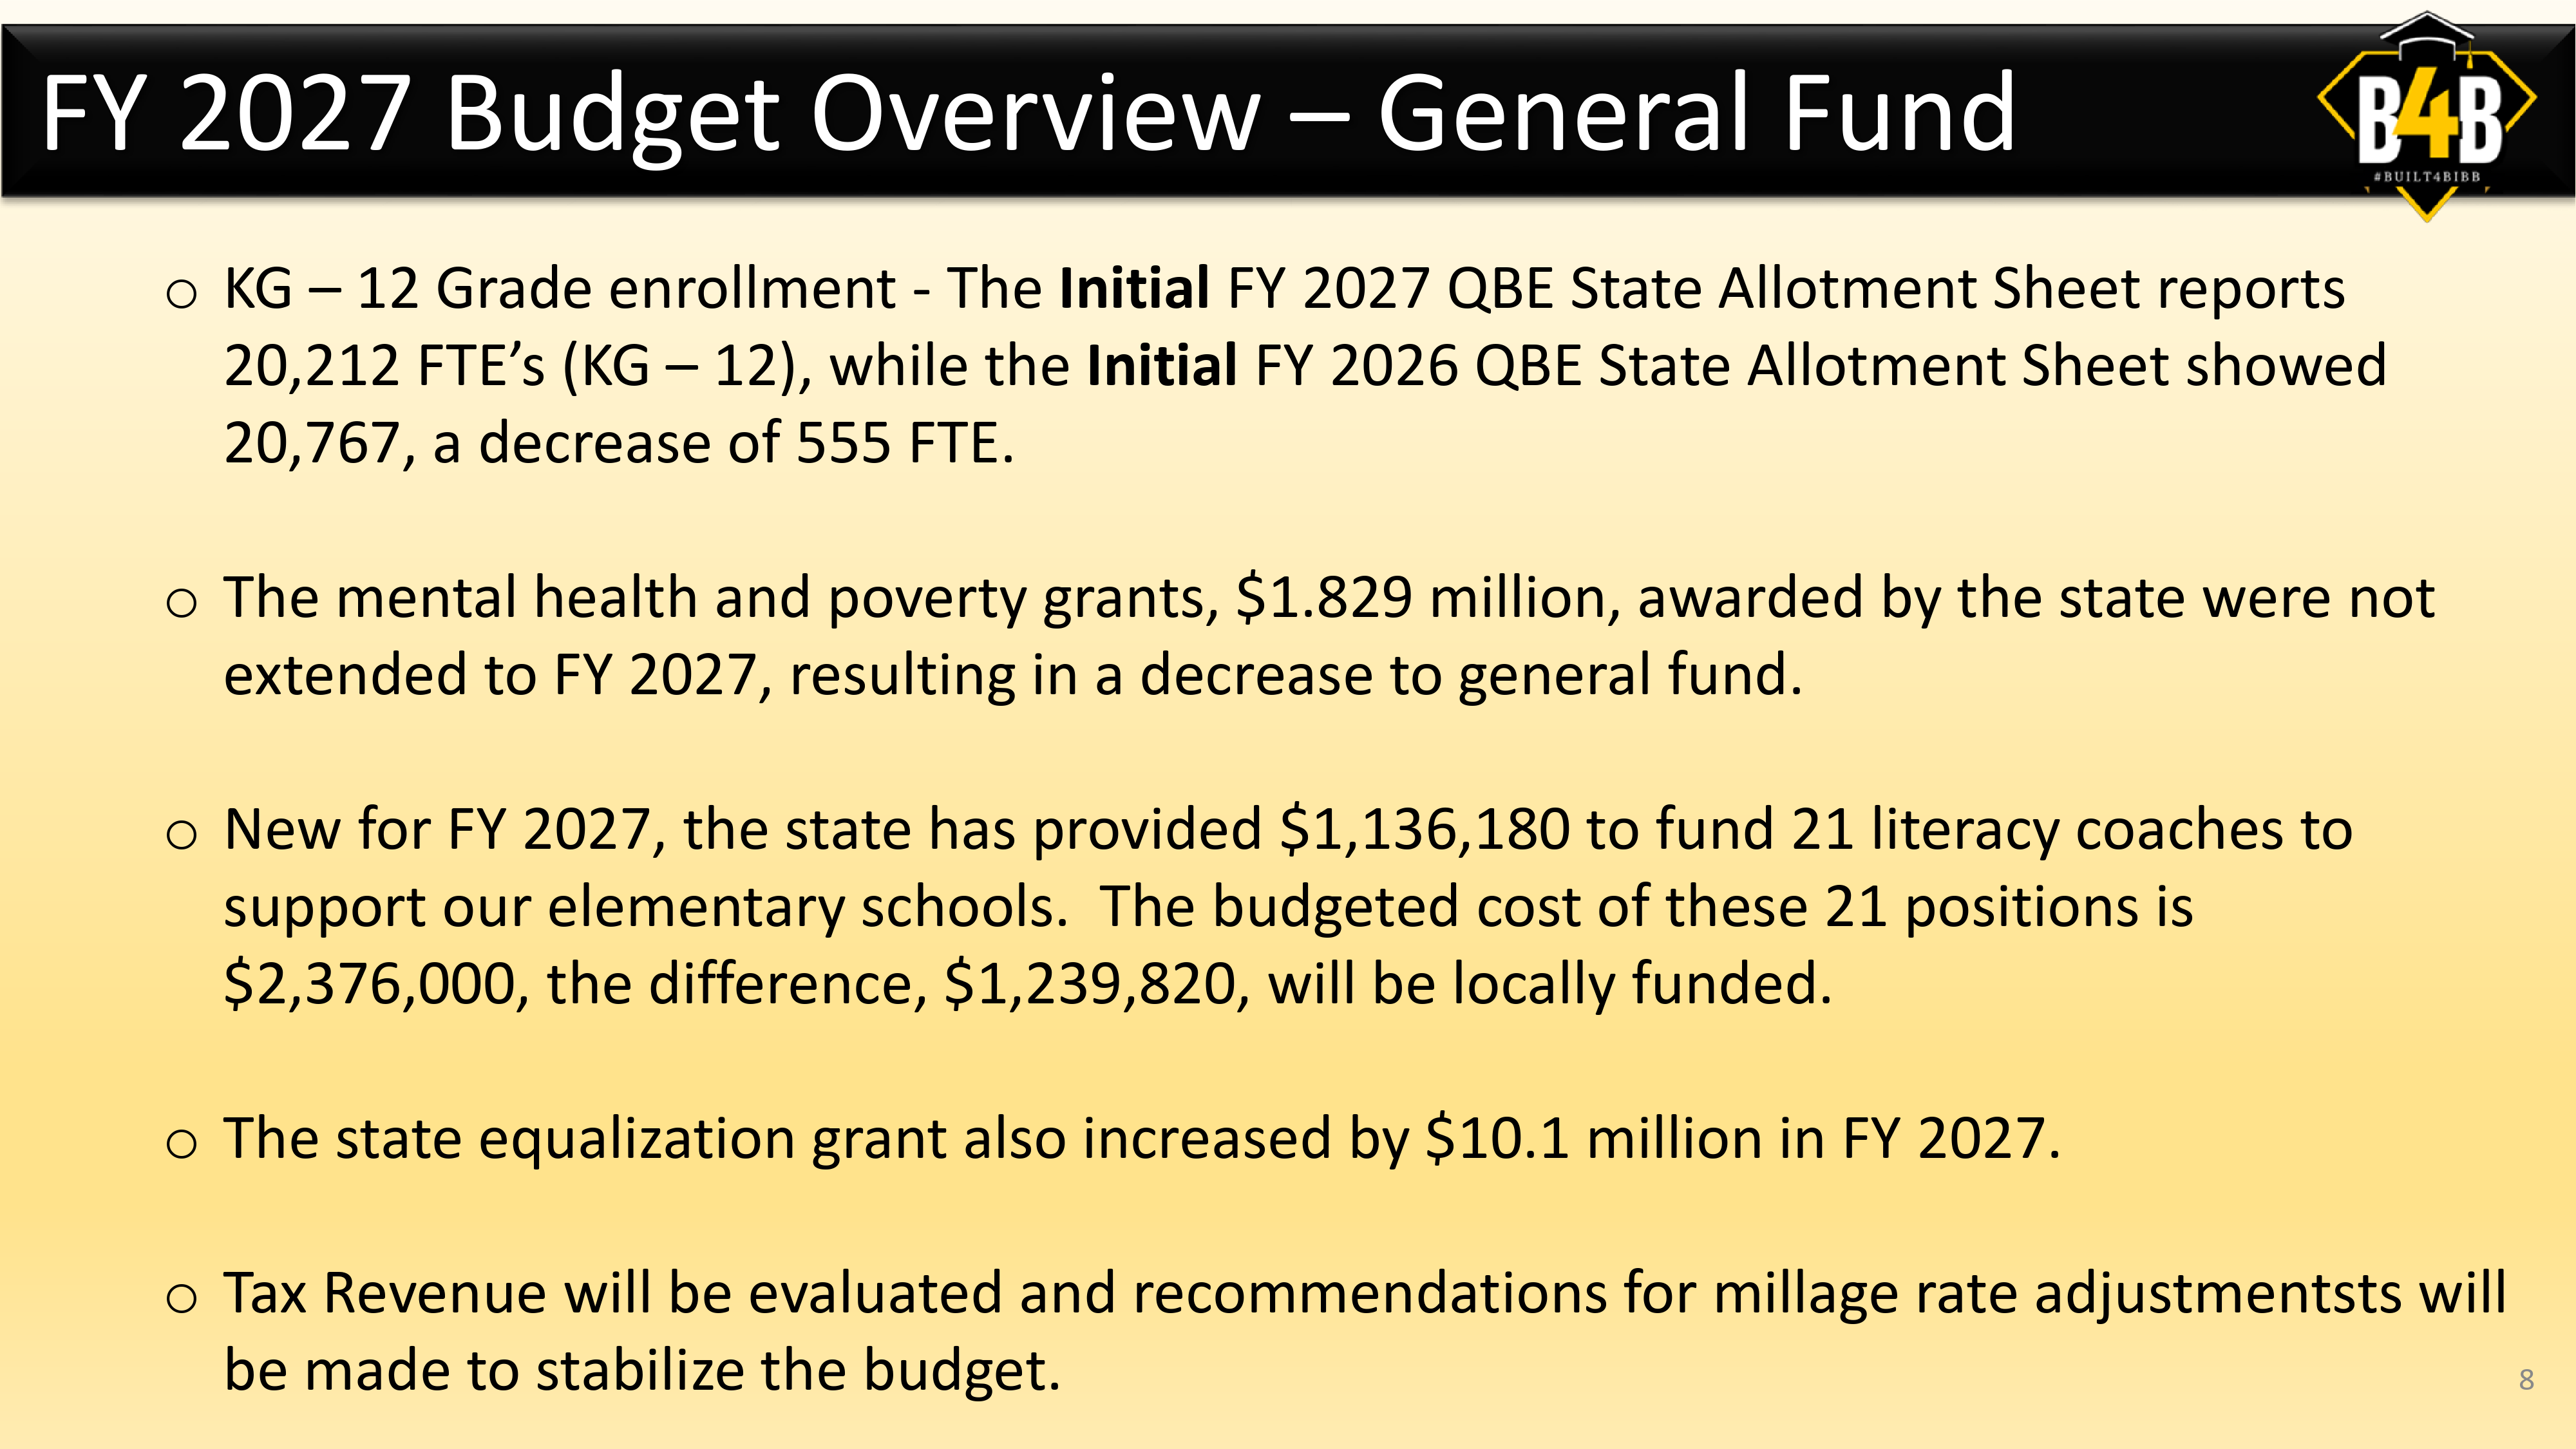
- Revenues and transfers in (FY27): $286.1M
- Total expenditures (FY27): $310.0M
- Net deficit (FY27): $(23.8M)
- Ending fund balance: $24.3M, a fund balance to expenditure ratio of 7.8%, down from 16.3% just a year ago
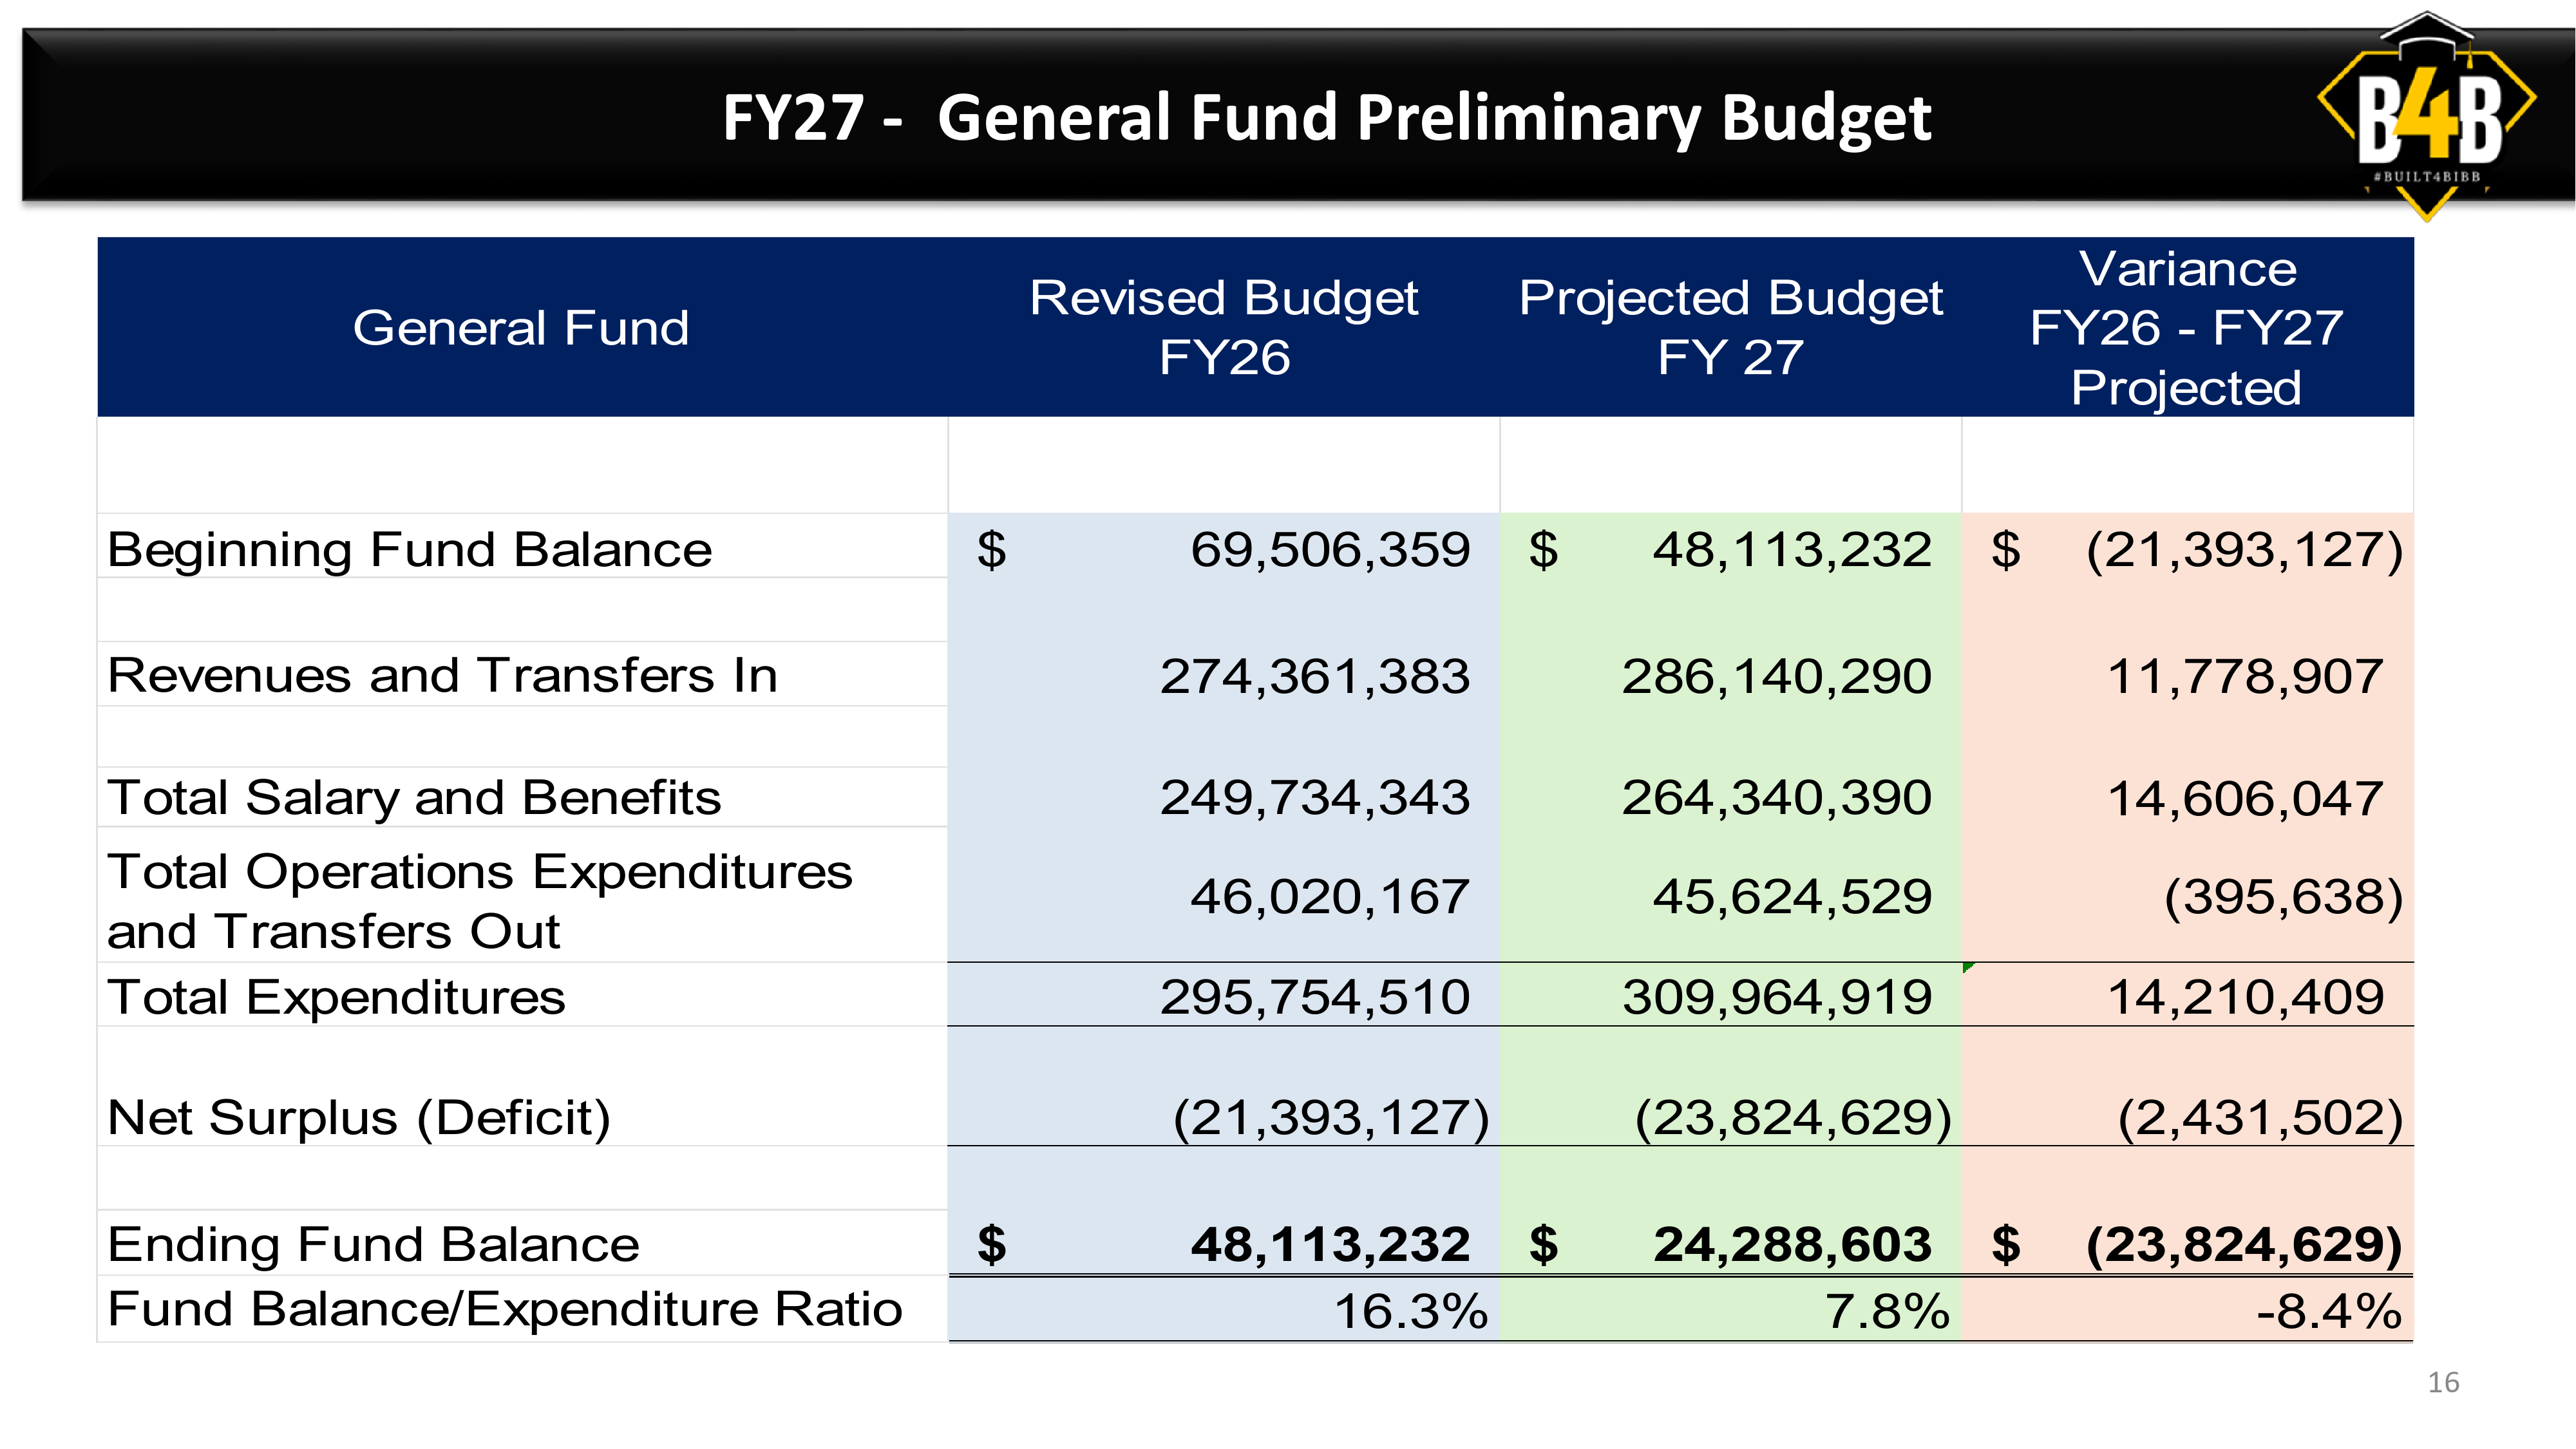
Read that bottom row twice.
Why 7.8% matters more than $23M
Schools don’t run on cash they collect this week. State and federal money arrives on a schedule that doesn’t match payroll. The district has to carry enough in reserve (its fund balance) to keep buses moving and paychecks cut between deposits.
Most lenders and ratings agencies look for a school district fund balance ratio in the 15–20% range. Bibb is projected to drop to 7.8% by the end of FY27. And if we hold this course, the same deck shows the ratio falling to 0.5% in FY28 and going to negative 14.3% by FY30.
A negative fund balance isn’t just a budget problem. That’s a the state is getting involved problem. Ask Dublin City Schools how that’s been working out.
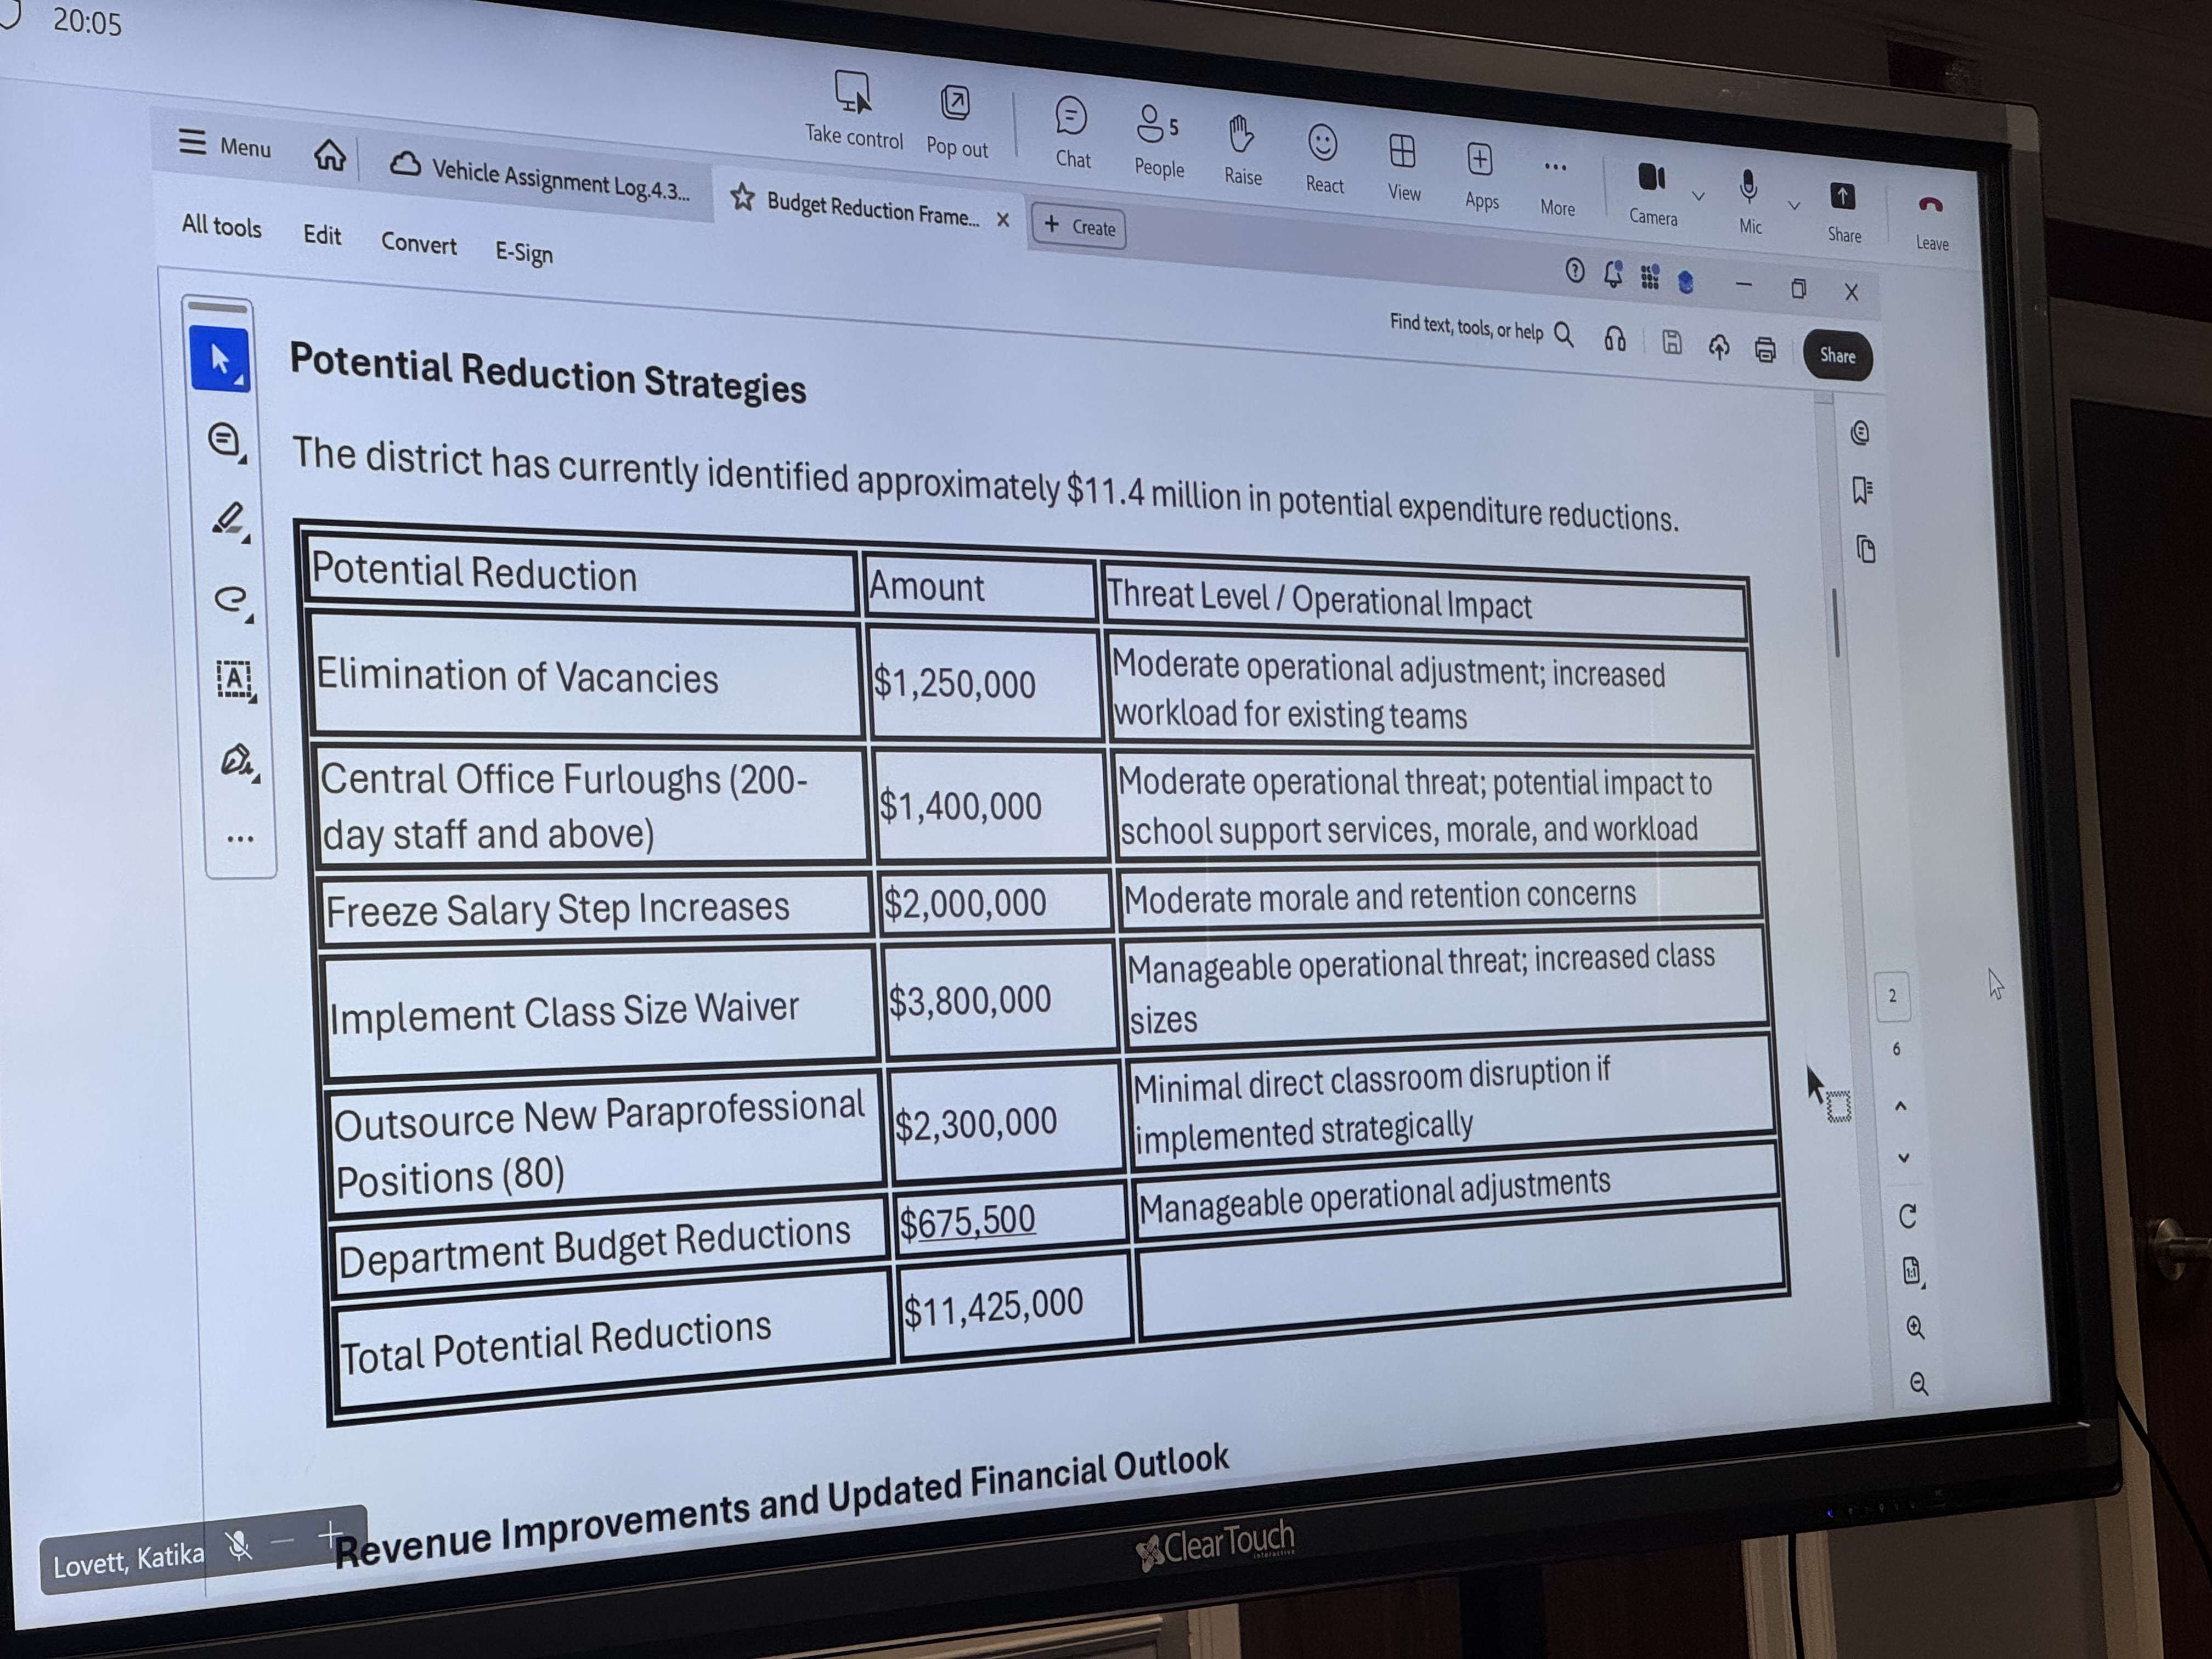
The cut menu
Thursday’s slides walked through what the district could cut if it had to. Again, not a recommendation. A floor.
The categories, roughly:
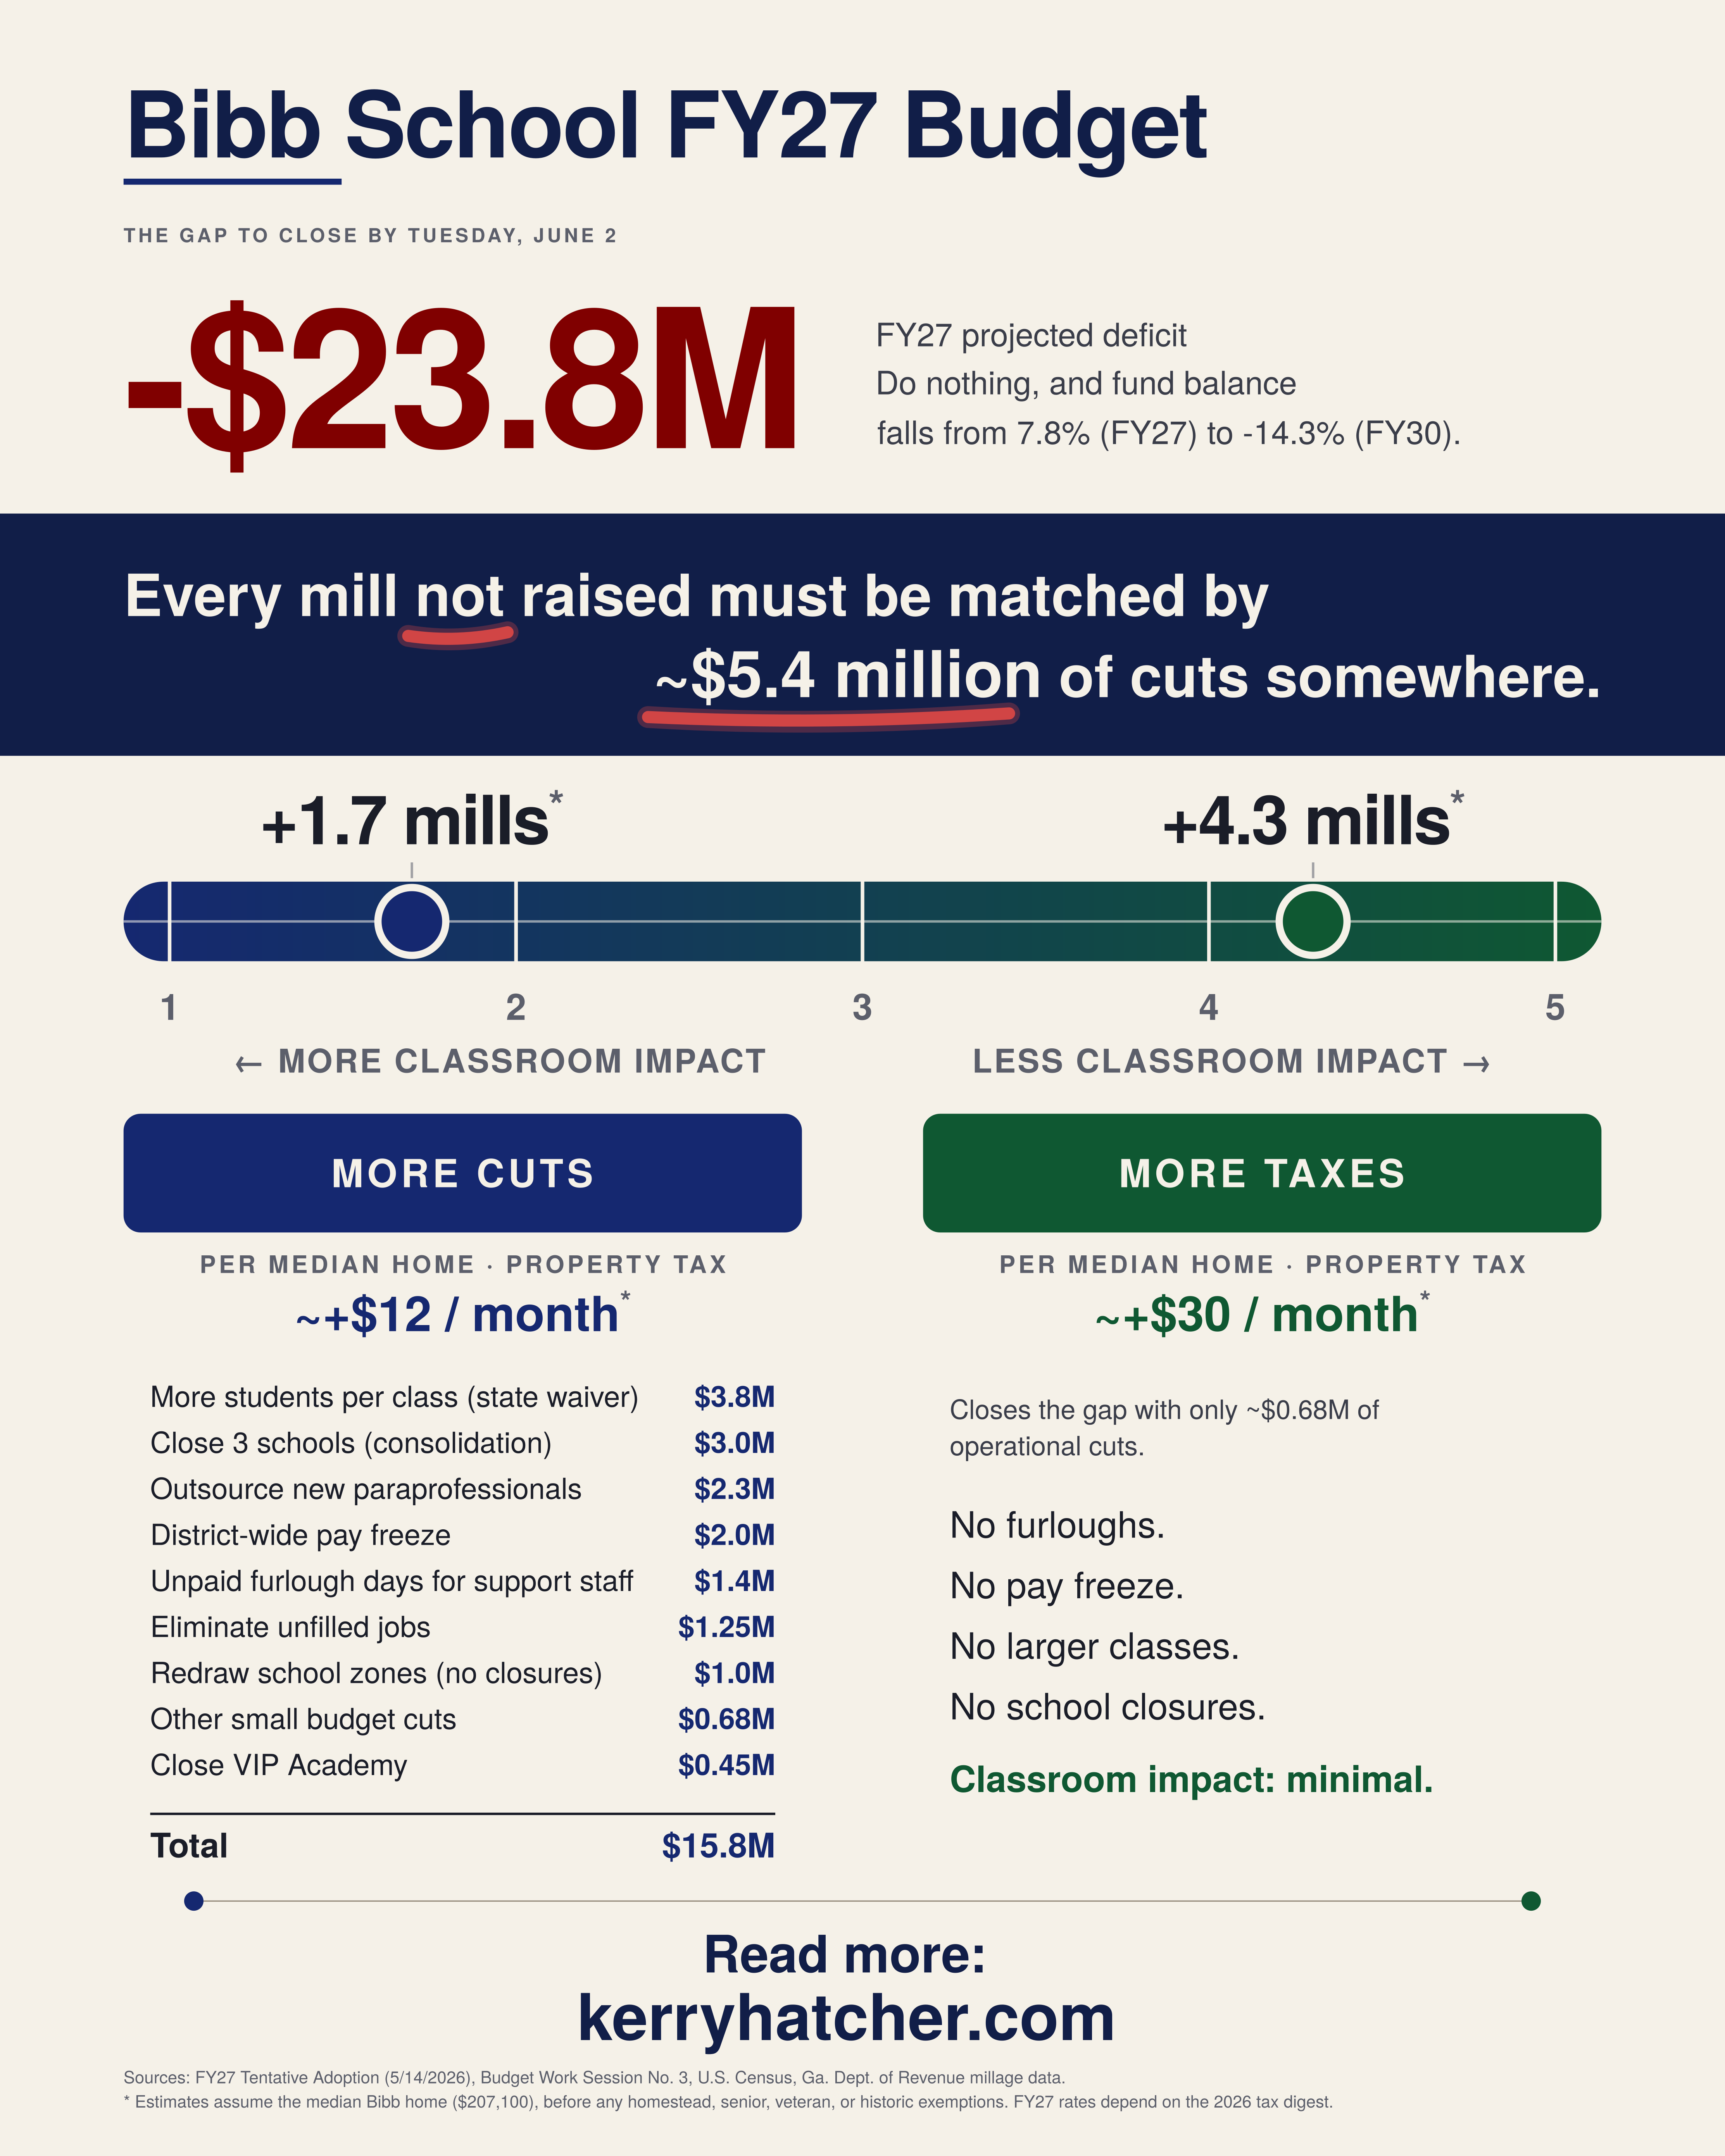
- Eliminate vacant positions — ~$1.25M
- Non-instructional staff furloughs (all 200+ work-day employees, not just Central Office) — ~$1.4M
- District-wide pay freeze — ~$2.0M
- Class size waiver (more kids per teacher) — ~$3.8M
- Outsource 80 new paraprofessional positions — ~$2.3M (outsourced paras lose TRS eligibility; board members flagged this as a recruitment risk)
- Other small cuts — ~$0.68M
Further cuts have been discussed previously outside the meeting:
- School consolidation — ~$3.0M
- Redistricting without closures — ~$1.0M
- Close the VIP academy — ~$0.45M
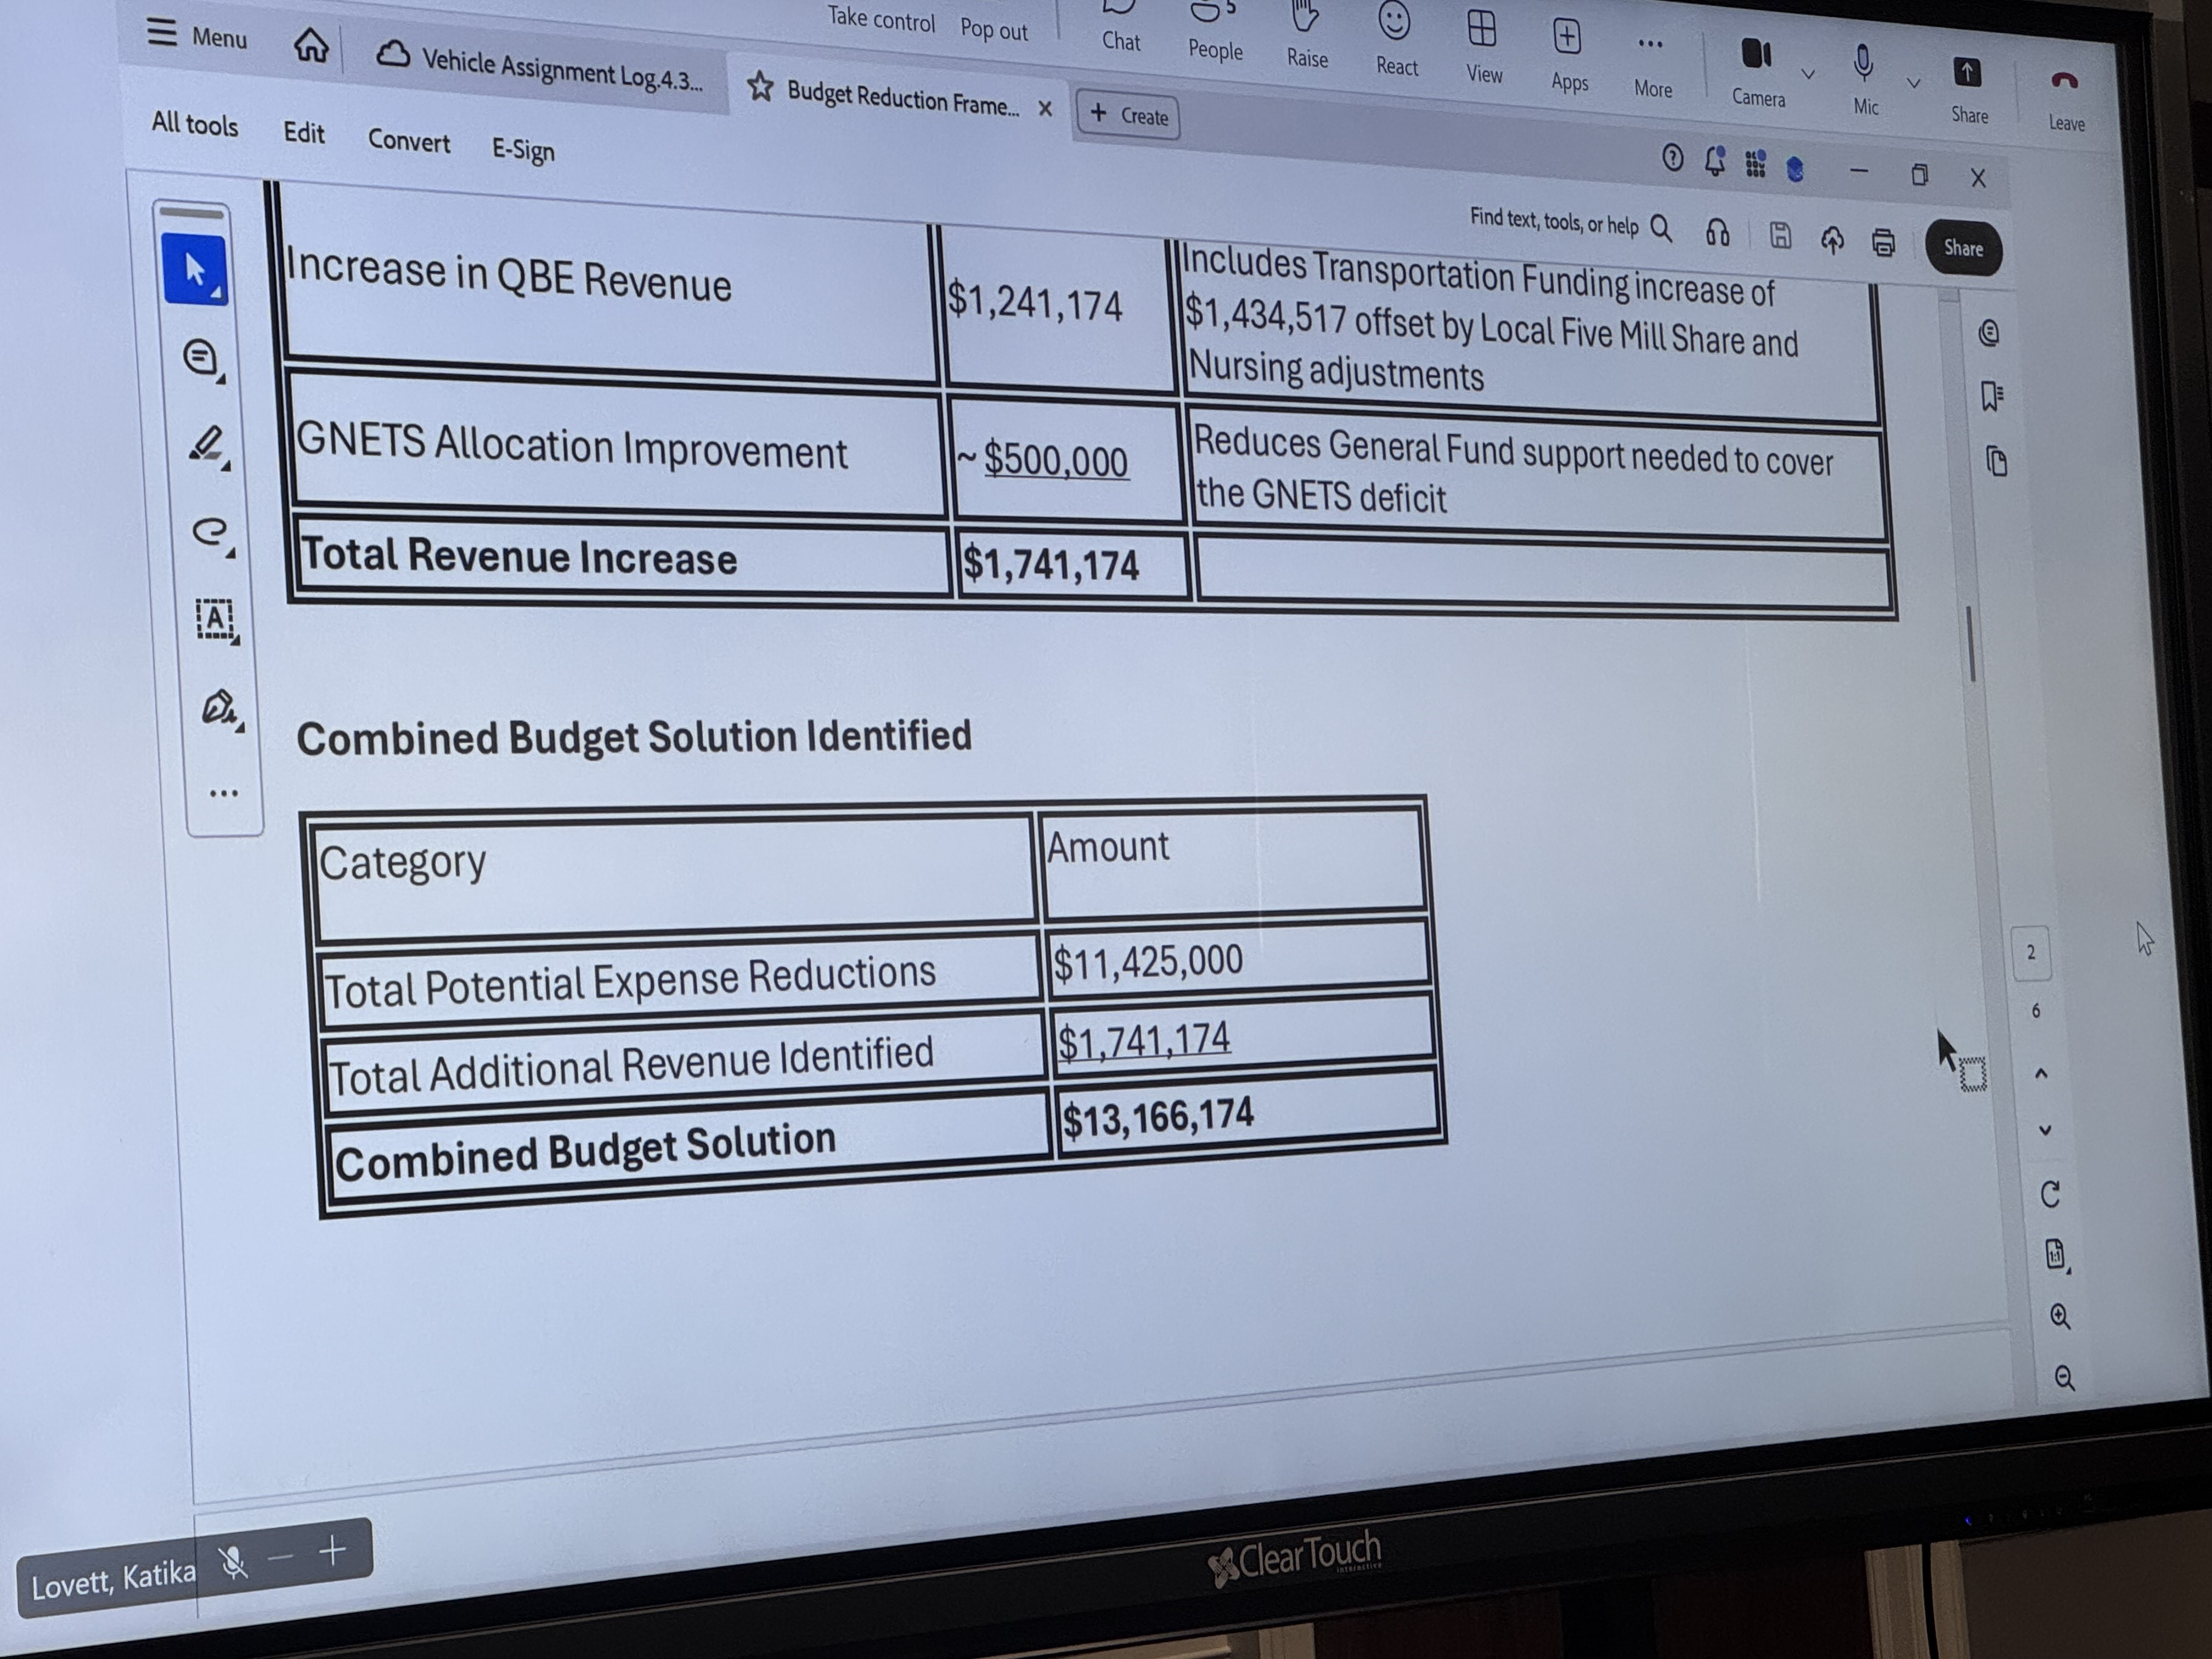
Total: about $15.8 million.
Apply every one of those, including the ones the Superintendent flatly does not recommend, and we are still $8 million short of balancing FY27. After consolidating schools, freezing pay, packing more kids into classrooms, and contracting out the people who hold our buildings together. Still short.
Board member James Freeman put the school consolidation line in sharp relief: the district has had three separate studies (efficiency, rezoning, and consolidation) running for as long as six years. None of them have actually changed anything. “Here I am six years in and we haven’t consolidated the schools, we haven’t rezoned the schools,” Freeman said. The $3M consolidation figure isn’t a new idea. It’s an answer that keeps getting deferred.
Here are the slides CFO Bush showed:
The only lever left
If the cut menu doesn’t get you there, the only remaining variable is revenue, and the only revenue lever the district actually controls is the millage rate.
The tentative adoption deck models four scenarios:
| Millage | FY27 Deficit | FY27 Fund Balance Ratio | FY30 Projected Ratio |
|---|---|---|---|
| 14.674 (current) | $(23.8M) | 7.8% | -14.3% |
| +2 mills (16.674) | $(14.3M) | 11.2% | -2.2% |
| +3 mills (17.674) | $(8.2M) | 13.1% | +5.5% |
| +4 mills (18.674) | $(2.2M) | 15.1% | +13.2% |
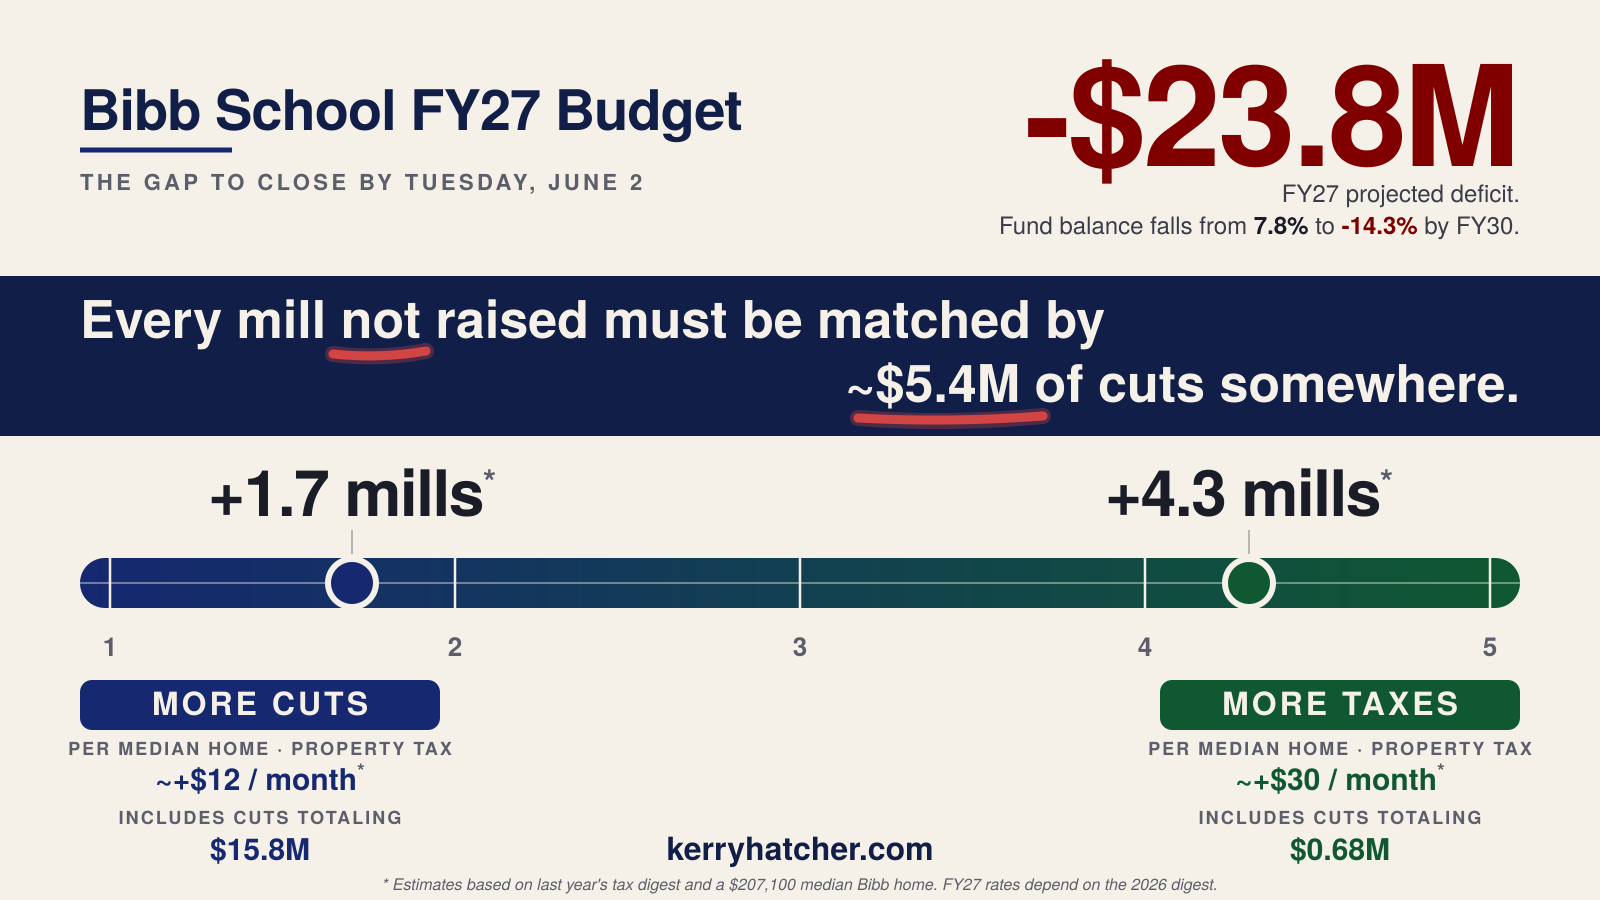
There’s no single right number. The math gives you a range: +1.7 mills with every cut on the menu, or +4.3 mills with minimal cuts. Anywhere in between, and the board picks the mix.
What I’m not saying
To be clear: I’m not telling anyone how to vote on the mills or the cuts. The tradeoffs are real in both directions. Higher taxes hit working families and seniors. Deeper cuts hit kids, teachers, and the staff who keep our schools open. I get why people land differently on that.
Board President Morton said it plainly at Thursday’s session: “We can’t tax our way out of our situation. We have to make fundamental changes in how we deliver education.” The mills and the structural changes aren’t either/or. We need both. The board knows it.
What I am saying is this: the numbers don’t negotiate, and the deadline is Tuesday, June 2.
Strictly speaking, June 2 is the tentative adoption. The board can still tweak the numbers before final passage at the June 18 hearing. In past years, though, the changes between tentative and final have been minimal at best. June 2 is where the direction gets locked in.
After June 2, the board owns whatever deficit it carries forward. Anything not fixed by then gets offset later, and “later” in school finance almost always means emergency loans, deeper cuts, or both.
What the range actually costs a homeowner
When I worked this out for the FY26 budget last year, one mill came to about $8 a month for the average Bibb homeowner. Property values have climbed since. Let’s redo the math with the current numbers.
In Georgia, your home’s assessed value is 40% of its market value. The latest U.S. Census ACS puts the median Bibb home at $207,100. So:
- $207,100 × 0.40 = $82,840 assessed value
- $82,840 ÷ 1,000 = $82.84 per mill, per year
- $82.84 ÷ 12 = $6.90 a month, per mill
On a median Bibb home, that’s roughly ~$12 a month at the cuts-heavy end of the range (+1.7 mills) and ~$30 a month at the revenue-heavy end (+4.3 mills). Less than a tank of gas, either way. And that’s before any homestead, senior, veteran, or historic-property exemptions you might qualify for, which can drop it further.
For comparison, here’s what nearby counties charge for schools:
| County | School Millage |
|---|---|
| Houston* | 11.72 |
| Bibb | 14.67 |
| Peach | 14.50 |
| Monroe | 16.21 |
| Jones | 16.31 |
| Richmond (Augusta) | 18.33 |
| Clarke (Athens) | 18.80 |
| Muscogee (Columbus) | 23.08 |
* Houston County has a local-option sales tax for schools (LOST) that Bibb is not legally allowed to use. The General Assembly grandfathered a few districts in years ago and we weren’t one of them.
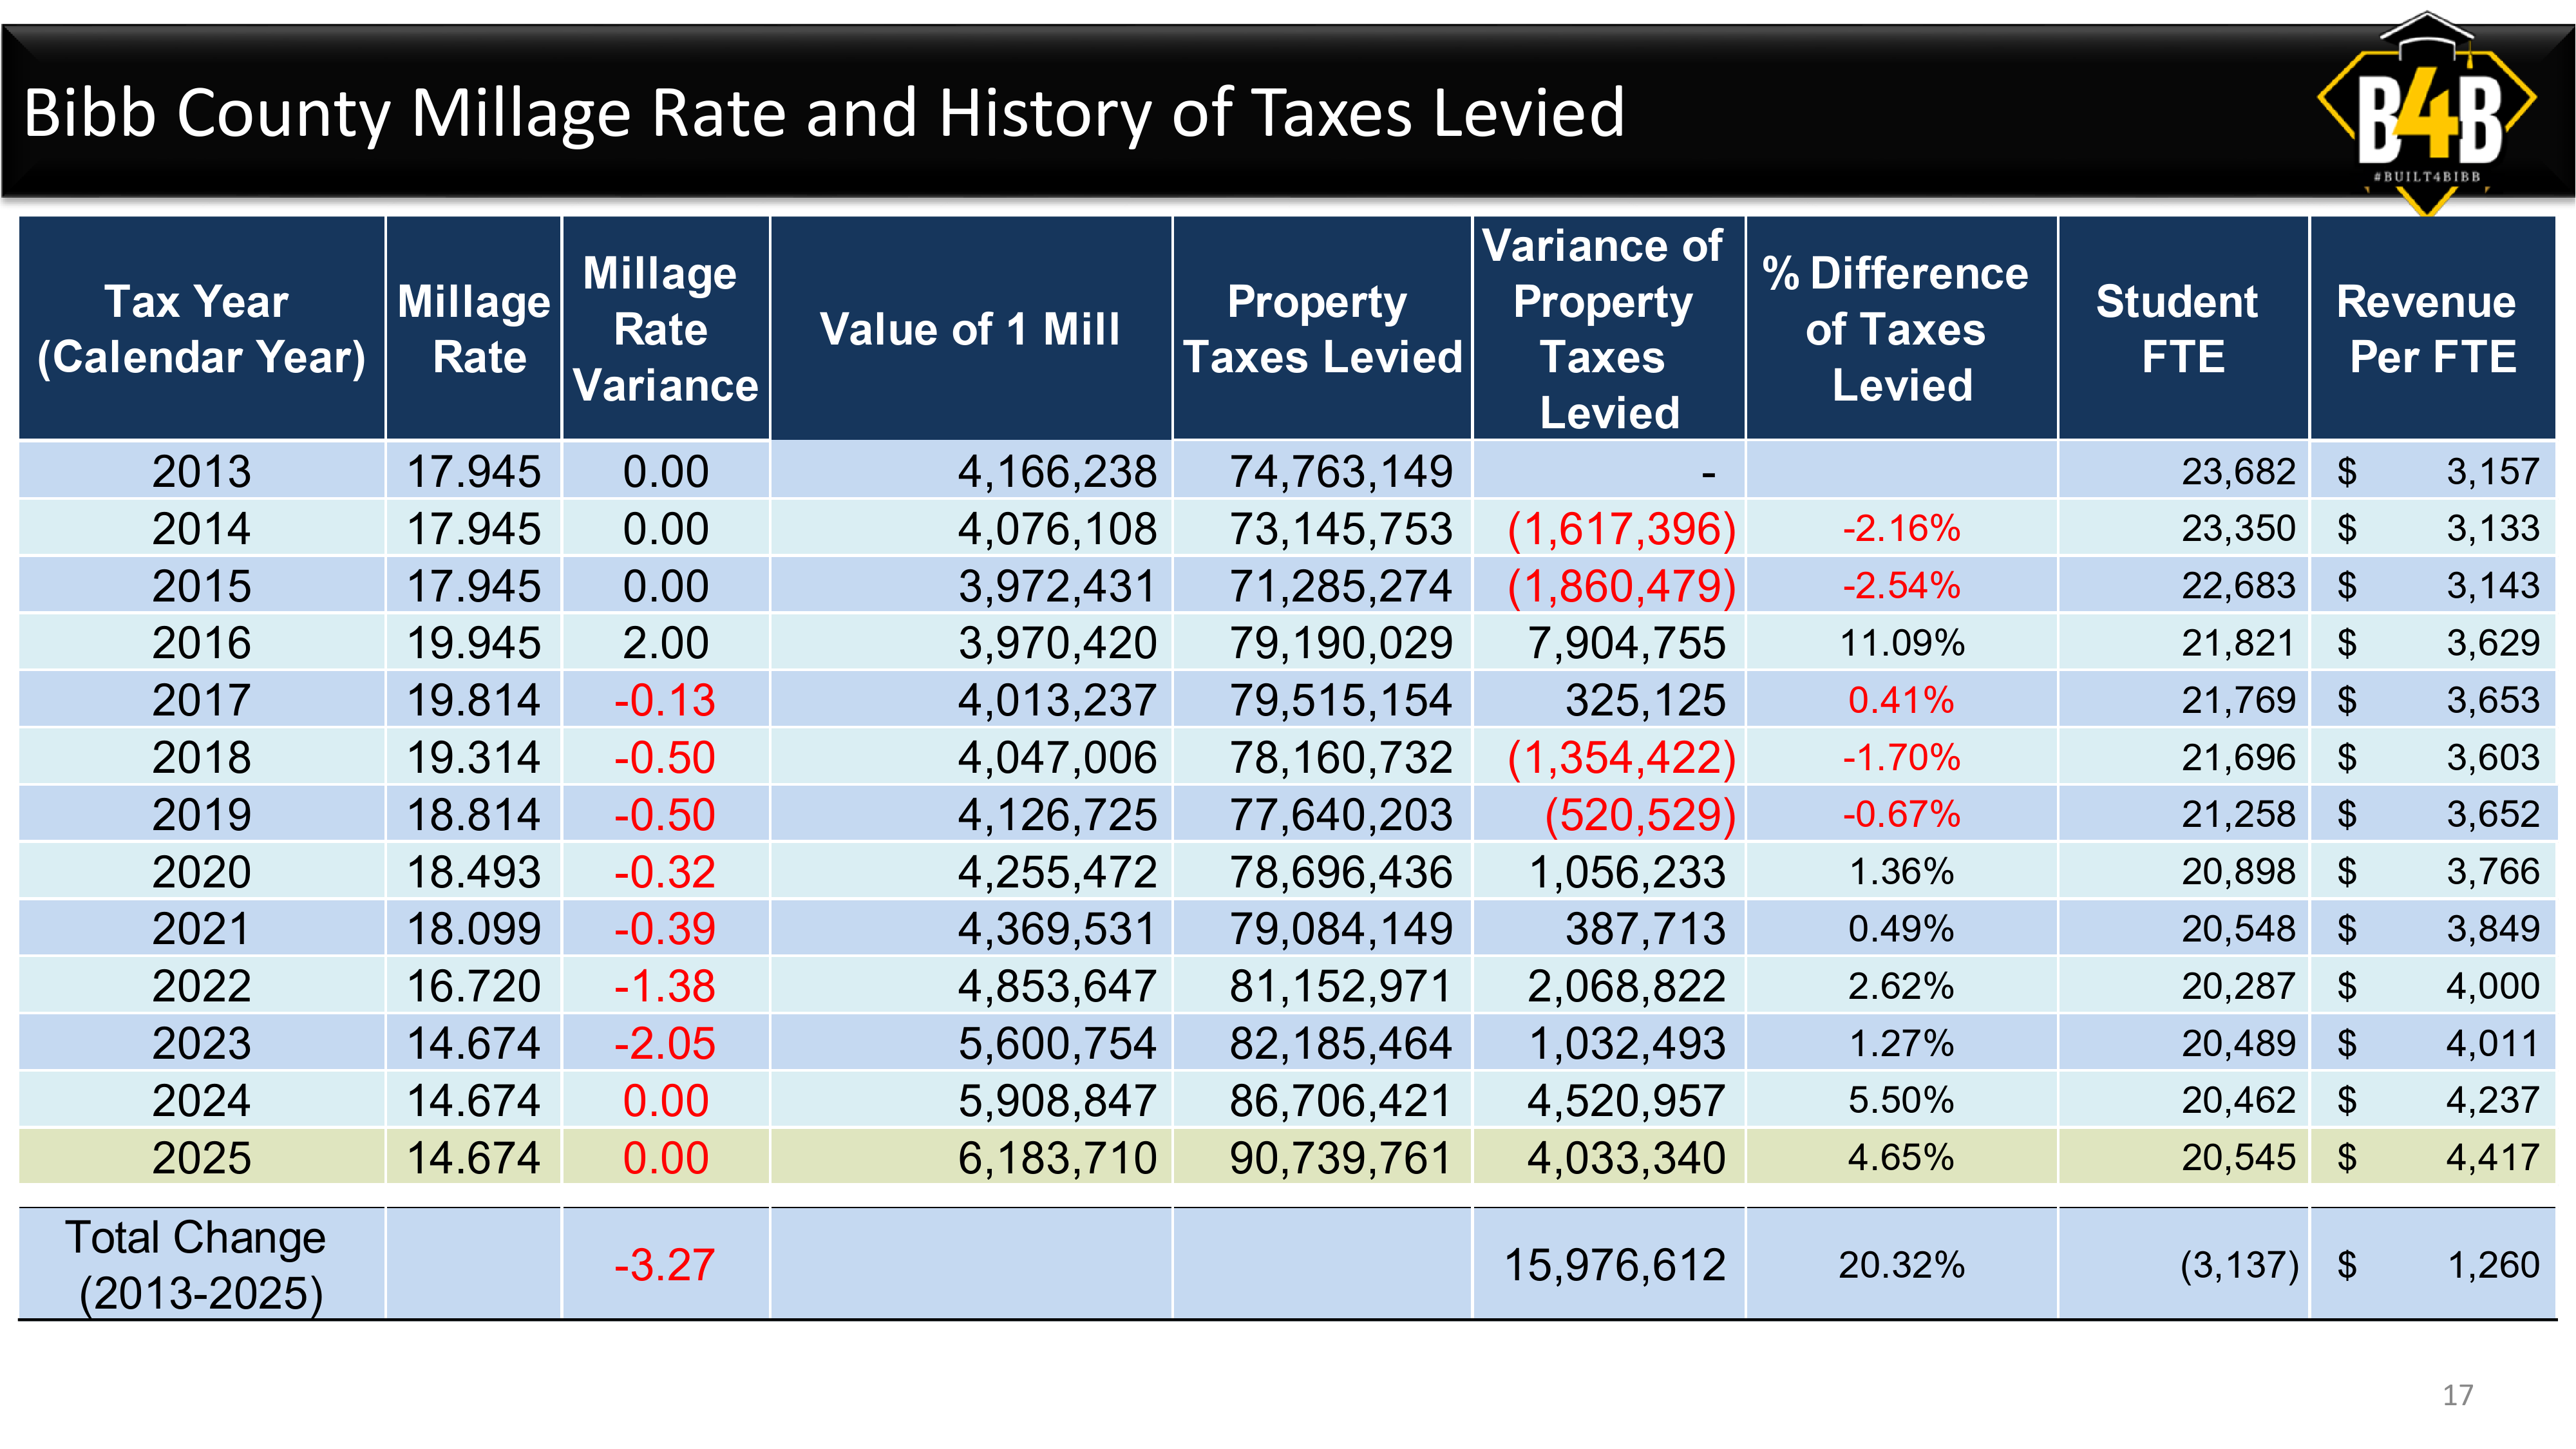
For the longer view: Bibb’s school millage has fallen 3.27 mills since 2013 through rollbacks. Holding the 2013 rate flat would have generated something like an extra $20 million a year by now, even with our lower student count. Those rollbacks weren’t free. We’re paying for them in this budget.
About last year
I’ll keep this short, because it isn’t the point of this post.
In FY26 I asked the board to balance the budget with a sub-2-mill increase. They voted to carry a deficit instead. That $21M deficit is the entire reason the beginning fund balance for FY27 starts at $48M instead of $69M. It’s also the reason the range we’re now discussing starts higher than it would have last year.
The pattern is the part worth noticing: every year the district waits, the price of waiting goes up. Not by a little. By about a mill.
One thing that could change this
Everything above assumes property valuations look like last year. They probably won’t. Most of Bibb saw significant valuation increases in 2025. Mine certainly did. The actual mill rate needed to close the deficit won’t be locked in until the tax digest is finalized next month.
The whole range could shift downward.
That’s worth keeping in mind when the conversation gets locked onto a specific number. The board still has to commit to a direction on June 2. The digest refines the math; it doesn’t reset the clock.
What to do before Tuesday, June 2
If you live in Bibb County, show up. This is when the deficit gets locked in, one way or another, and even if you don’t speak, a full room means something. If you can’t be there, email the board. Their addresses are here. Tell them which tradeoff you’d accept and which you wouldn’t.
And share this post. The empty-chair problem at these meetings is real, and I’ve written about it before. If you’ve made it this far, you know more about the FY27 budget than 99% of Bibb County. Help fix that ratio.
I’ll be at the meeting. Whether the board lands on cuts, a mill increase, or some mix of both, the worst outcome is the one we already know: another deferred deficit, another year of pretending, and a much larger bill in FY28.
We’ve run out of runway.
Thank you,
— Kerry
Contact me on Signal: kerryhatcher.03
Share the full breakdown
If you found this useful, the full infographic below summarizes everything: the deficit, the cut menu, the two paths, and what each end of the range actually costs a homeowner. Save it, send it, post it.